As covered briefly in part one, a big part of “The Heart” was its almost infinite powers to gather data from any thinkable source; phones, cameras, microphones, bank records, medical records etc.. There was a desire to showcase these abilities in the holograms, through displaying huge quantities of data, and showing how The Heart would filter through it all when coming up with it’s answers.
Houdini, as I covered in part one, is well suited for working with data of different types, so this article will be about how you can use Houdini to essentially visualize data. And as a disclaimer; this isn’t really a groundbreaking use case of Houdini, and there are likely to be better/smarter ways of doing things than what I’m outlining here.
Unlike part one, this article won’t be specific to anything we did for Heart of Stone, but more of an holistic insight into various methodologies we explored and used on that project in the realms of data visualisation.
Getting the data in to Houdini
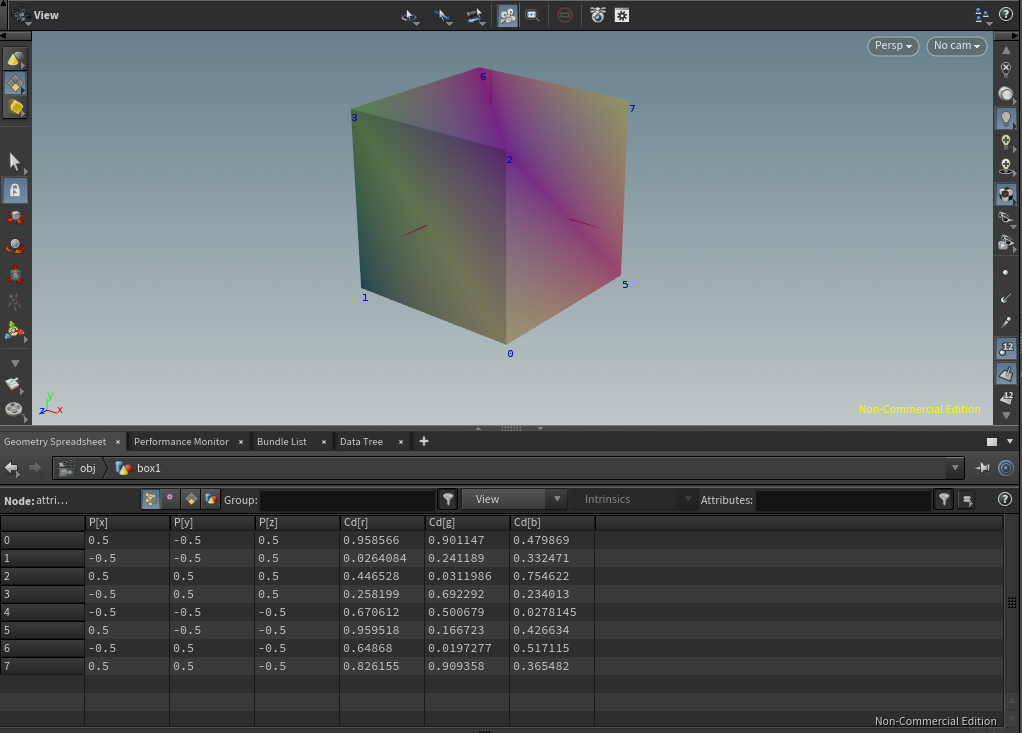
Houdini and its ability to visualize and manipulate data, as unsexy as it might sound, is a fundamental part of the software. With dedicated parts of the UI essentially allowing you to look at 3D models as numbers in a spreadsheet rather than as polygons in a viewport.
One thing you might find when you go looking for data sources is that certain formats and file types occur more often than others.”csv” files are a good example. CSV is actually so common that Houdini comes with a pre-made node for being able to read them; Table Import. A pretty simple, but really useful node for anyone who wants to dabble into visualizing data in Houdini. Let’s give it some data and see if we can come up with something to visualize.
A quick google search led me to a data-set showing crimes in Los Angeles , and it included fields like time/date and locations as lat/lon coordinates, which is something I know the Table Import SOP can do cool things with. So I’m going to use that data set as an example. Regardless of what data-set you intend to bring into Houdini, it’s useful to take a look at it in something like Excel or Google Sheets first, so that you can have more of an educated guess as to what data might be interesting to you.
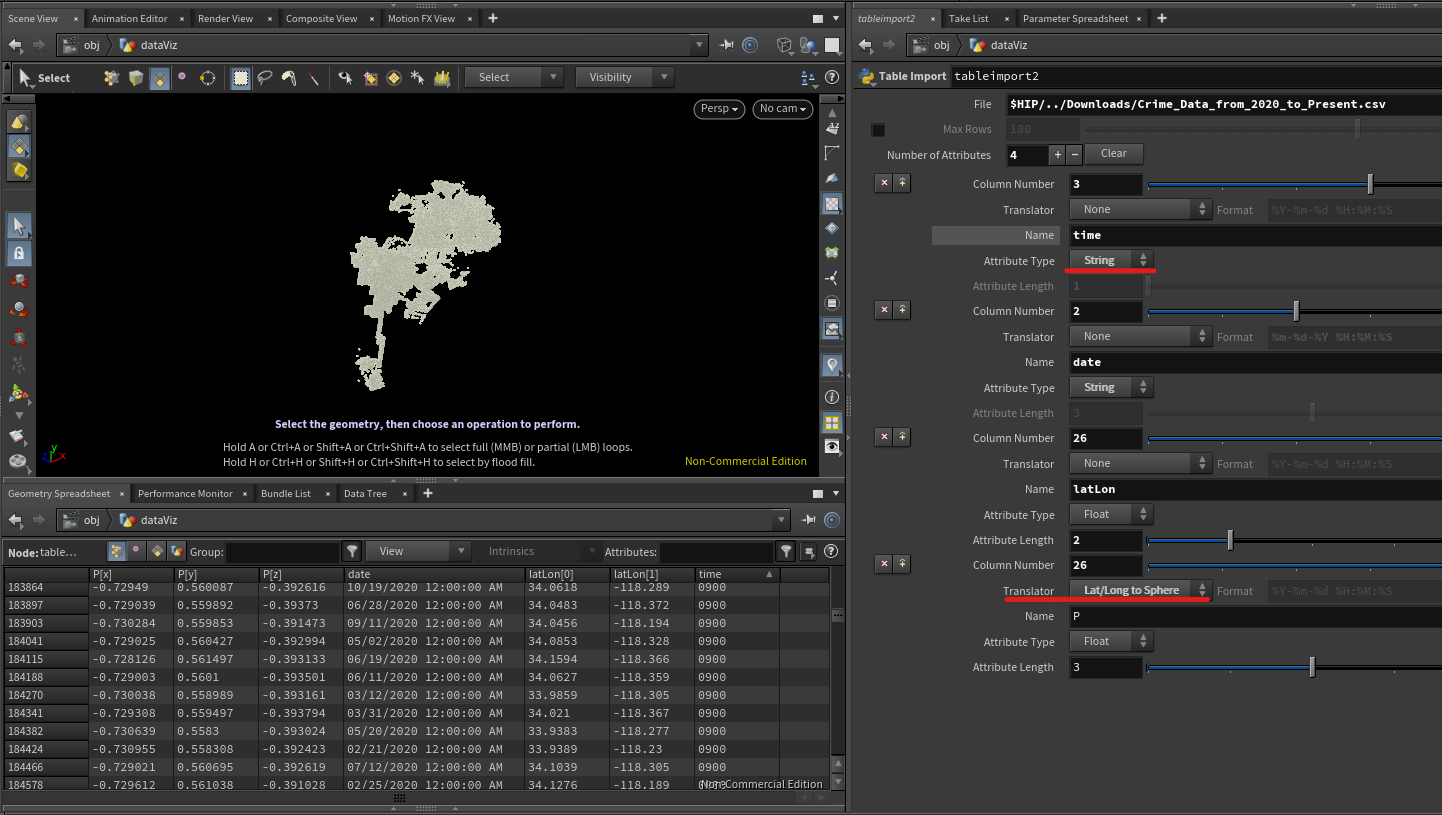
This screenshot shows the basics of how the node works; you add however many attributes you want, and by setting the “Column Number” parameter you choose which column from the csv/spreadsheet it should use, and for each row in the csv I’ll get a point with the attributes stored on it. In this example I’m only reading a few attributes, but obviously nothing is stopping us to add more later if we want to. The Translator parameter offers a couple of really handy tools for dealing with certain data types like geo locations and dates, and I’m using that Translator to convert the lat/long data to a spherical mapping. The “Date to Seconds” option might not be intuitively useful, but a thing you realize when you start looking at time data and sorting things chronologically is that the various formattings of dates and times (YYYY/MM/DD, DD/MM/YYY,DDMMYYYY and so on..) make it very annoying to work with. By converting date and/or times into a single value of seconds it becomes trivial to do basic arithmetic and all sorts of things and you’ll just be happier. Trust me.
Having said that, in this particular case I couldn’t get the built in Translator to do the work for me when I gave it the date, and secondary this particular dataset had the time as a separate column, so I opted for just storing the two attributes; date and time as strings, knowing that I would need to further massage that data.
Prepping the data
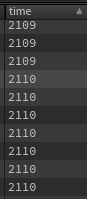
So we’ve got a MM/DD/YYYY format, and I’ve noticed that 12:00:00 AM is constant, which makes sense since time is stored as a separate value.So I’ll ignore the time component of the date attribute.
On the top of my head I don’t know how to convert a date into seconds, so I’ll ask ChatGPT. After a couple of prompts and some minor tweaks I’m left with the following code that will run in a Python SOP
import hou
from datetime import datetime

# Function to convert date string to seconds
def date_to_seconds(date_str):
    # Parse the date string into a datetime object
    date_obj = datetime.strptime(date_str, "%m/%d/%Y")

    # Convert the datetime object into a Unix timestamp
    timestamp = date_obj.timestamp()

    return int(timestamp)

# Get the input geometry
geo = hou.pwd().geometry()

# Get the point attribute "date" and create a new attribute "date_seconds"
date_attr = geo.findPointAttrib("date")
if date_attr is not None:
    date_seconds_attr = geo.addAttrib(hou.attribType.Point, "date_seconds", 0)

    # Loop over points
    for point in geo.points():
        date_str = point.attribValue(date_attr)
        seconds = date_to_seconds(date_str.split(" ")[0])
        point.setAttribValue(date_seconds_attr, seconds)
else:
    raise ValueError("Attribute 'date' not found on points.")
import hou
from datetime import datetime

# Function to convert date string to seconds
def date_to_seconds(date_str):
    # Parse the date string into a datetime object
    date_obj = datetime.strptime(date_str, "%m/%d/%Y")

    # Convert the datetime object into a Unix timestamp
    timestamp = date_obj.timestamp()

    return int(timestamp)

# Function to convert time string to seconds
def time_to_seconds(time_str):
    # Parse the time string into hours and minutes
    hours = int(time_str[:2])
    minutes = int(time_str[2:])

    # Convert hours and minutes to seconds
    seconds = hours * 3600 + minutes * 60

    return seconds

# Get the input geometry
geo = hou.pwd().geometry()

# Get the point attribute "date" and create a new attribute "date_seconds"
date_attr = geo.findPointAttrib("date")
if date_attr is not None:
    date_seconds_attr = geo.addAttrib(hou.attribType.Point, "date_seconds", 0)

    # Loop over points
    for point in geo.points():
        date_str = point.attribValue(date_attr)
        seconds = date_to_seconds(date_str.split(" ")[0])
        point.setAttribValue(date_seconds_attr, seconds)
else:
    raise ValueError("Attribute 'date' not found on points.")

# Get the point attribute "time" and create a new attribute "time_seconds"
time_attr = geo.findPointAttrib("time")
if time_attr is not None:
    time_seconds_attr = geo.addAttrib(hou.attribType.Point, "time_seconds", 0)

    # Loop over points
    for point in geo.points():
        time_str = point.attribValue(time_attr)
        seconds = time_to_seconds(time_str)
        point.setAttribValue(time_seconds_attr, seconds)
else:
    raise ValueError("Attribute 'time' not found on points.")
With just a few basic attributes prepared we can do a number of interesting visualizations already.
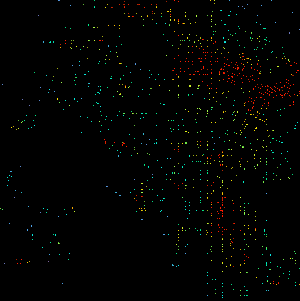
Also, we have barely scraped the surface of the initial data-set; we could add attributes that describe the type of crime, the age of the victim and a number of other interesting pieces of data; which in turn will lead to more things we could visualize
| Here's another couple of examples showing some of the things we can do with our data | |
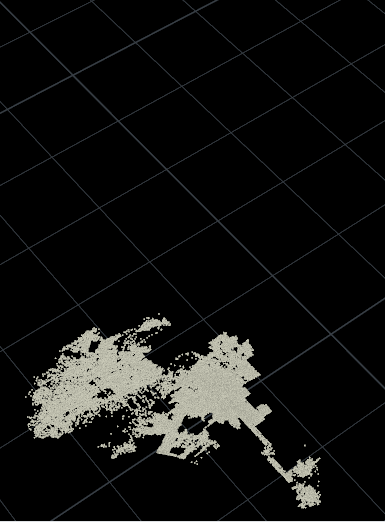 |
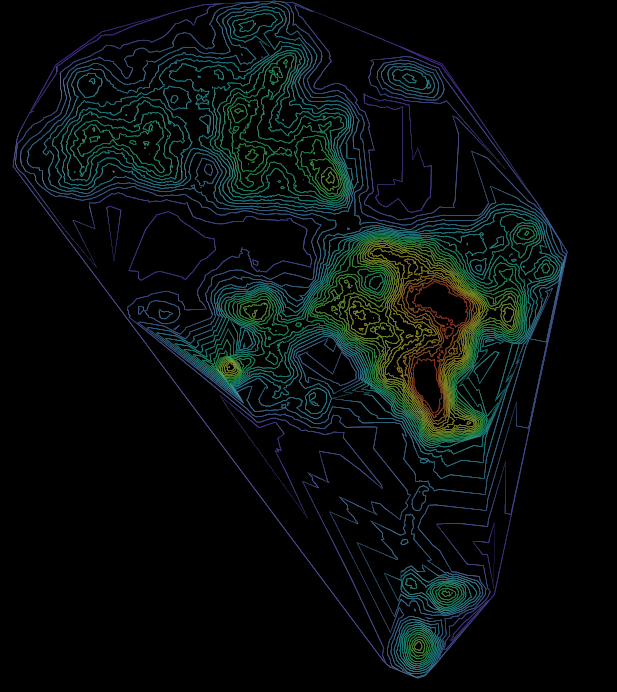 |
| Points>Triangulate2d>Diplaces>Slize | "Topographic" map of crime in Los Angeles |
In the interest of keeping the article at a sensible length I’ll stop here, but hopefully it's given you a taster for how we can work with external data in Houdini and create cool visuals with them. My next article will be focusing on a different project entirely, but I intend to revisit the topic of data visualization in Houdini again in the future so stay tuned.
For further reading/watching on the subject I recommend the following